Bitcoin price climbed above the $66,000 resistance zone and started consolidation. BTC is now eyeing the next move above the $67,200 resistance zone.
- Bitcoin is eyeing a decent increase above the $67,200 resistance zone.
- The price is trading above $65,500 and the 100 hourly Simple moving average.
- There is a connecting bullish trend line forming with support at $65,900 on the hourly chart of the BTC/USD pair (data feed from Kraken).
- The pair could gain bullish momentum if it clears the $67,200 resistance zone.
Bitcoin Price Eyes More Upsides
Bitcoin price started a fresh increase above the $65,500 and $66,000 resistance levels. BTC even climbed above the $67,000 level. It traded as high as $67,200 and is currently consolidating gains.
There was a minor decline below the $66,500 level, but the price remained stable above the 23.6% Fib retracement level of the upward move from the $64,280 swing low to the $67,200 low. Bitcoin price is still trading above $65,500 and the 100 hourly Simple moving average.
There is also a connecting bullish trend line forming with support at $65,900 on the hourly chart of the BTC/USD pair. The trend line is near the 50% Fib retracement level of the upward move from the $64,280 swing low to the $67,200 low.
Immediate resistance is near the $67,000 level. The first major resistance could be $67,200. A clear move above the $67,200 resistance might send the price higher. The next resistance now sits at $68,500. If there is a clear move above the $68,500 resistance zone, the price could continue to move up. In the stated case, the price could rise toward $70,000.
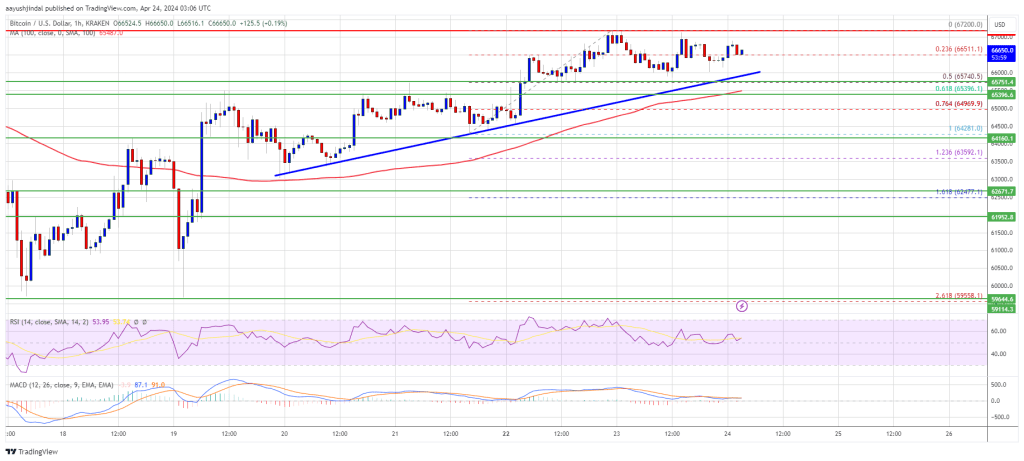
Source: BTCUSD on TradingView.com
The next major resistance is near the $70,500 zone. Any more gains might send Bitcoin toward the $72,000 resistance zone in the near term.
Are Dips Limited In BTC?
If Bitcoin fails to rise above the $67,000 resistance zone, it could start a downside correction. Immediate support on the downside is near the $66,200 level.
The first major support is $66,000 or the trend line. If there is a close below $66,000, the price could start to drop toward $65,400. Any more losses might send the price toward the $64,200 support zone in the near term.
Technical indicators:
Hourly MACD – The MACD is now losing pace in the bullish zone.
Hourly RSI (Relative Strength Index) – The RSI for BTC/USD is now above the 50 level.
Major Support Levels – $66,200, followed by $66,000.
Major Resistance Levels – $67,000, $67,200, and $68,500.